Understanding Bitcoin’s Recent Pullback
Bitcoin, the leading cryptocurrency by market capitalization, has recently experienced a notable pullback to its Daily Exponential Moving Average (EMA) 8. This movement raises questions about whether the bulls will maintain their momentum in the face of potential resistance. In this article, we will delve into the implications of this pullback, analyze market trends, and explore what it means for traders and investors.
What is EMA and Its Significance?
Exponential Moving Average (EMA) is a type of moving average that places a greater weight and significance on the most recent data points. It is a crucial tool for traders as it helps smooth out price action and provides a clearer view of the price trend over time. The Daily EMA 8, in particular, is calculated using the last eight days of price data, giving traders insight into short-term price trends.
Key reasons why traders focus on EMA:
Current Market Analysis
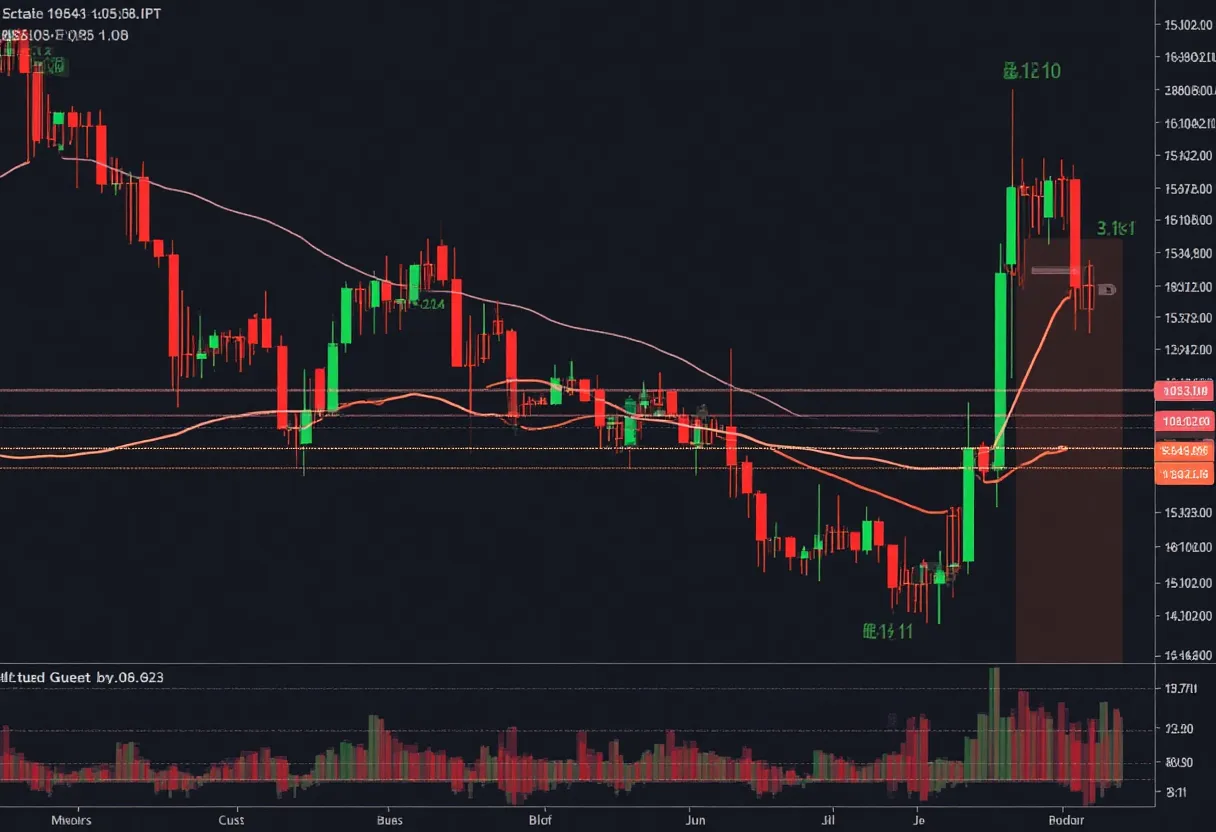
As Bitcoin pulls back to the Daily EMA 8, it is essential to analyze the broader market conditions that might affect the cryptocurrency’s price action. Recent trends have shown increased volatility, driven by various factors such as regulatory news, market sentiment, and macroeconomic events.
Factors influencing Bitcoin’s price movement include:
The Bullish Perspective
For the bulls, the pullback to the Daily EMA 8 could present a buying opportunity if the support level holds. Historically, price retracements to key moving averages like the EMA 8 have often been followed by bullish reversals. If buyers can step in and defend this level, it may signal continued upward momentum.
Potential bullish signals to watch for:
The Bearish Perspective
Conversely, if the price fails to hold above the Daily EMA 8, it could indicate weakness among buyers, leading to further declines. A break below this key level may trigger stop-loss orders and provoke a sell-off, attracting bearish sentiment.
Key bearish indicators include:
The Role of Market Sentiment
Market sentiment plays a critical role in determining Bitcoin’s price action. The behavior of traders, influenced by news events, social media, and community discussions, can lead to rapid price fluctuations. Hence, monitoring sentiment through platforms like social media and trading forums can provide insights into how traders might react to the pullback.
Indicators of market sentiment include:
Technical Indicators to Monitor
As traders watch the pullback to the EMA 8, several technical indicators can provide additional context to the current market conditions:
Important technical indicators include:
Conclusion: What Lies Ahead for Bitcoin?
As Bitcoin pulls back to its Daily EMA 8, the next few trading sessions will be crucial in determining the market’s direction. If the bulls can hold their ground and maintain momentum, we may witness a resurgence in price. However, should the bears take control, a deeper pullback could ensue.
Traders and investors should stay vigilant and use a combination of technical analysis, market sentiment, and fundamental insights to navigate these uncertain waters. As always, risk management remains key in the volatile world of cryptocurrency trading.
In summary, the ongoing developments in Bitcoin’s price action will be critical to watch. Whether you are a seasoned trader or a newcomer to the cryptocurrency market, keeping an eye on these indicators and trends will be vital for making informed decisions. The coming days will reveal whether the bulls can maintain their strength or if the bears will take over.